

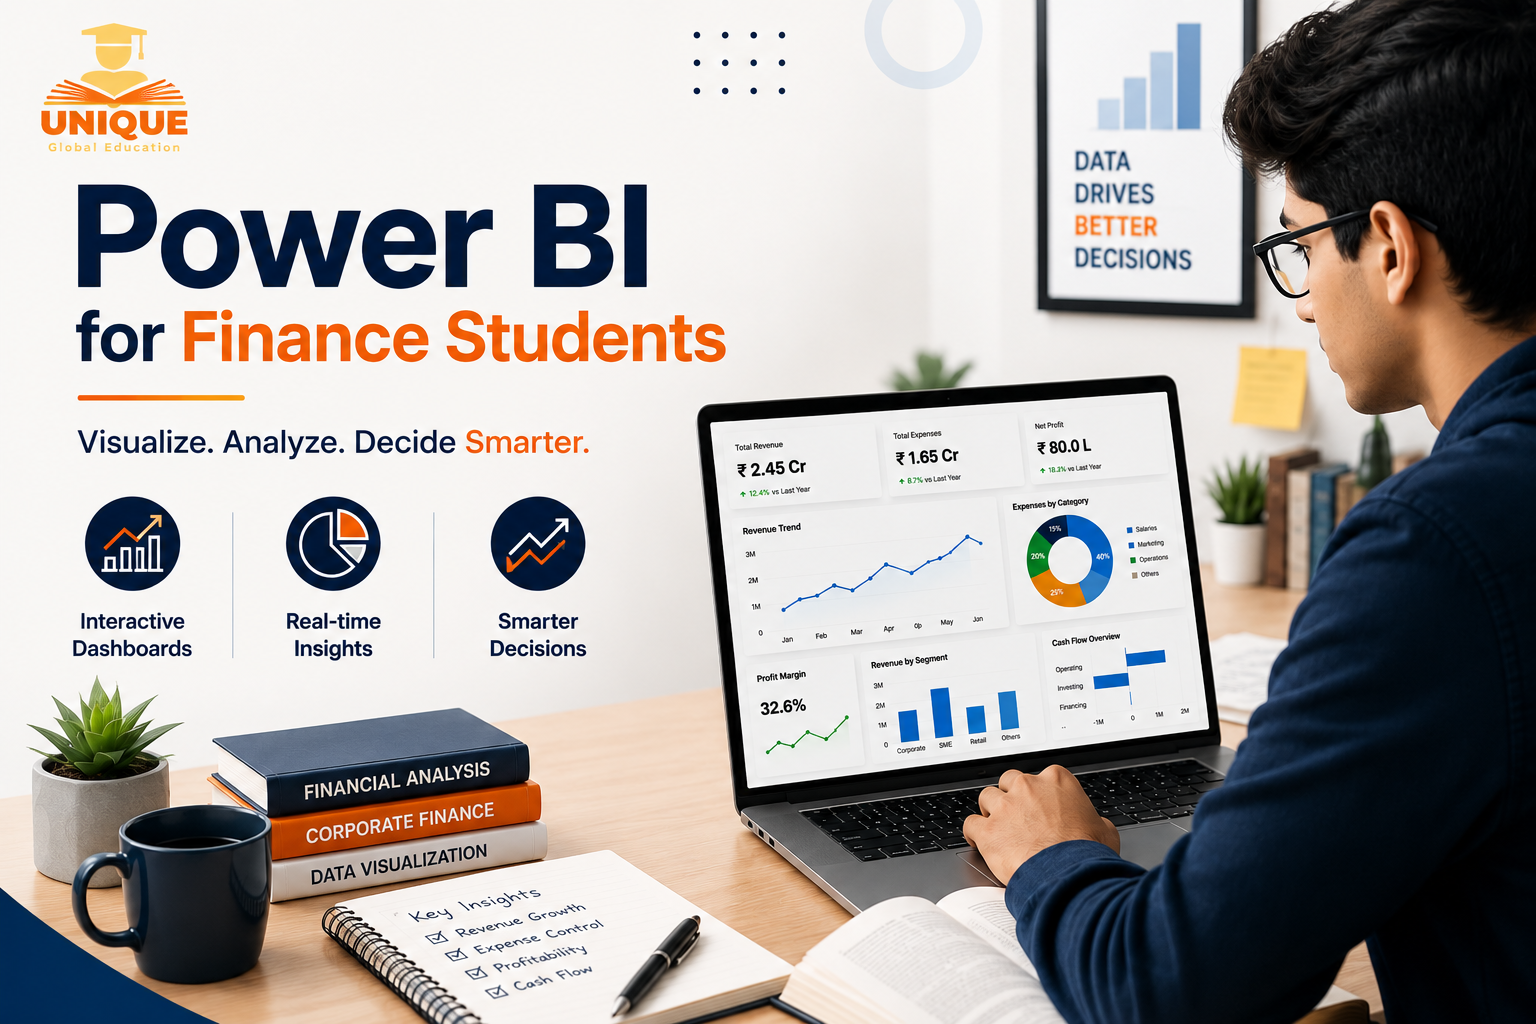
A junior I was mentoring sent me his resume a couple of months back, right before he started applying for analyst roles. Good academics, a decent internship, all the right words about financial analysis and reporting. Then I asked if he’d worked with Power BI even once. He didn’t get why I was asking. He figured Excel was still enough. Power BI for Finance Students is becoming an increasingly useful skill, especially for those looking to move into analyst, reporting or FP&A roles.
It reminded me of the conversations people were having about Excel modelling ten years back, except now it’s dashboards instead of spreadsheets.That exchange stuck with me. It says something about where finance is actually headed. Power BI isn’t an optional extra anymore for someone who wants to work in finance or reporting.
It’s become about as basic a requirement as Excel used to be, and at this point that shift has already settled across most mid-size and large companies.For anyone who hasn’t used it: Power BI is Microsoft’s business analytics tool. It pulls data from multiple places, Excel files, databases, ERP systems, cloud platforms, and turns it into dashboards you can click through and interact with.
Instead of a static sheet full of rows and numbers, you get reports that update themselves as new data comes in. A finance team can set up a dashboard tracking revenue, expenses, cash flow, and have it refresh every morning without anyone touching it.
Table of Contents
Why Power BI for Finance Students specifically matters right now
Finance roles used to be fairly separate. Either you did the number work in Excel, or someone in a data team handled the reporting. That line has mostly disappeared. Companies want finance people now, even junior ones, who can pull data, clean it, and present it so someone outside finance gets it in ten seconds. That’s the gap Power BI closes.
Put yourself in a hiring manager’s seat for a second. Two candidates for an FP&A role. One builds a live dashboard showing budget against actual spend across departments. The other hands over a static Excel file. There’s no real contest. The first person is saving time and making the numbers accessible to people who don’t live in spreadsheets all day. That’s real value, not a technical flex.
There’s a more practical reason too. Data volumes at most companies have grown a lot, and finance teams are often pulling from several systems at once, ERP, CRM, banking feeds, payroll. Stitching all that together manually in Excel gets painful past a certain size. Power BI does the consolidation for you and lets you build models connecting across sources without needing a data engineer sitting next to you every time something shifts.
I was skeptical of all this myself for a while, if I’m being honest. My own background is heavy on statutory compliance and secretarial work, where Excel and Word were basically the whole toolkit. But watching how fast reporting expectations changed, even in compliance-heavy corners of finance, convinced me this wasn’t a fad. Boards want real-time, visual information now. Nobody’s waiting for a monthly report when a dashboard shows the same thing as of this morning.
Visit Unique Global Education for more Finance Related Updates
What Learning Power BI Looks Like for Finance Students
The good news: if you already understand financial statements and have reasonable Excel skills, you’re not starting from zero. A lot of the logic carries over. Understand what a pivot table does, and Power BI’s data modelling ideas click faster, since a chunk of it is built around similar concepts of aggregating and slicing data.
Most students spend their first few weeks on Power Query, the data cleaning and transformation layer, then move to DAX, the formula language behind calculated measures. DAX can feel intimidating at first, particularly coming from an accounting background rather than a technical one. But the logic isn’t as far removed from Excel formulas as it looks once you get past the unfamiliar syntax.
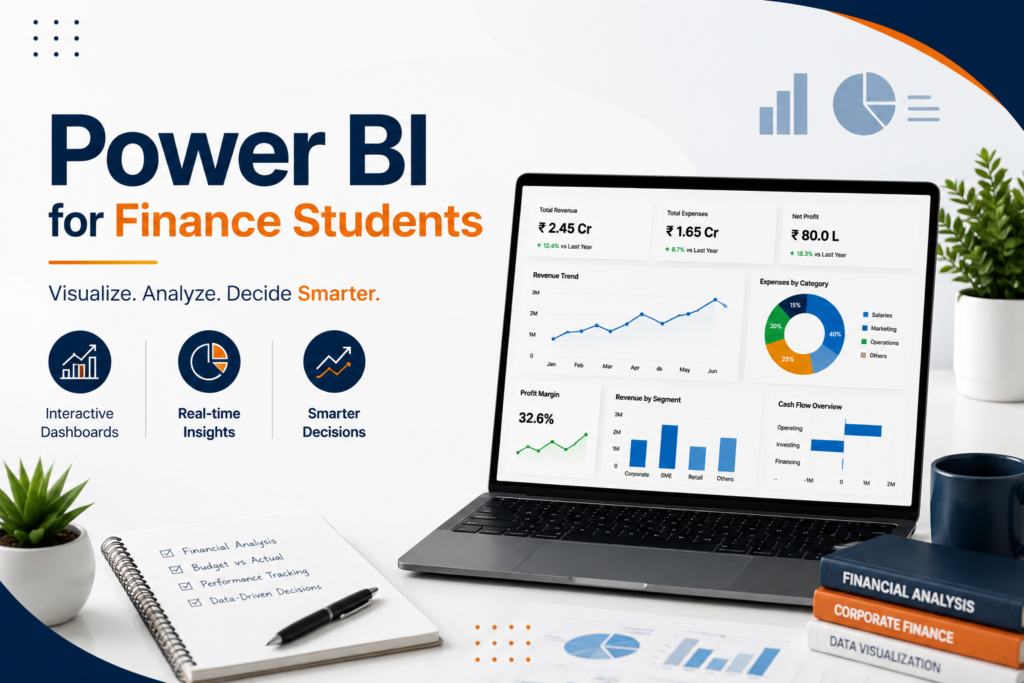
After that, it’s mostly practice. Take a dataset, sales figures, financial statements pulled from an annual report, and try building a simple dashboard on your own. Revenue trends, expense breakdowns, profit margins by segment. You’ll get the data model wrong a few times early on. That’s fine. Those mistakes teach faster than any tutorial does.
If you’re still unsure whether it’s worth your time, here’s my honest take: don’t treat it as some separate technical skill disconnected from your finance education. Treat it as an extension of financial analysis, just with a different toolkit. The finance students with an edge over the next few years won’t necessarily be the ones with the highest marks. They’ll be the ones who can take messy data and turn it into something a decision maker can actually use quickly.
Frequently Asked Questions
No. This is probably the biggest misconception keeping finance students from even trying. Basic dashboard building in Power BI is mostly visual, drag and drop. DAX means writing formulas, but it’s closer to Excel than to actual programming. You don’t need Python or SQL to get started, though picking up basic SQL later helps once you’re working with bigger datasets.
Not really. FP&A, financial reporting, corporate finance, even audit and compliance roles increasingly expect some familiarity with it now. Any role where you regularly report numbers to stakeholders benefits from showing that data visually instead of just emailing a spreadsheet.
They’re not competing. They solve different problems. Excel is still the right tool for detailed calculations and one-off analysis. Power BI comes in when the reporting is recurring rather than a one-time thing, or when the dataset’s too big for Excel to handle comfortably. It also lets stakeholders dig into the numbers on their own instead of emailing you for an updated file every other day.
If you’re already comfortable with Excel and pivot tables, most students can get to a reasonably functional level within four to six weeks of consistent practice. Getting genuinely strong at DAX and building more complex data models takes longer, closer to a few months of regular hands-on work.
Based on what I’ve seen with students I’ve mentored recently, yes, noticeably so. It’s becoming a common screening question in interviews for analyst and FP&A roles, and candidates who can talk through an actual dashboard they built tend to stand out compared to those who can only describe Excel work. It’s turning into one of those skills that isn’t mandatory on paper yet, but functions as one in practice.
Read More
Excel Skills Finance Students Need for Job Interviews
Corporate Finance: Career Guide, Roles & Skills